Reporting has always been part of how teams understand what is working and what is not. Earlier, most of this work was done manually. People would pull numbers from different platforms, organise them in spreadsheets, and then turn them into reports. It worked, but it took time and effort every single time.
Now things look different. Data is spread across multiple tools, campaigns run continuously, and decisions need to be made faster. This is where automated reporting starts to make sense. In this blog, we will look at how automated and manual reporting compare, where each one fits, and what changes when you move from one to the other.
What is Automated Reporting?
Automated Reporting is a way of creating reports where most of the work is handled by a system instead of a person. Once you connect your data sources, the tool pulls information automatically, organizes it, and displays it in a dashboard or report format.
You do not have to log in to multiple platforms every time. You do not have to copy-paste data or fix formatting again and again. The system keeps updating itself based on real-time or scheduled data syncs.
Over time, this changes how teams work. Instead of spending hours building reports, they start spending more time understanding the numbers and acting on them. That shift is what makes automated reporting more than just a time-saving tool.
What is Manual Reporting?
Manual reporting is the traditional way of handling data. It involves collecting information from different sources, combining it in spreadsheets, and then presenting it in a structured format like Excel files or slide decks.
This approach gives you full control over what goes into the report and how it looks. But it also means every report starts from scratch. Even if the format stays the same, the process has to be repeated each time.
For small datasets or one-time reports, this can still work. But as the number of campaigns, clients, or platforms increases, manual reporting starts becoming harder to manage. Most of the effort goes into preparation rather than analysis.
Automated vs Manual Reporting at a Glance
| Aspect/Features | Automated Reporting | Manual Reporting |
|---|---|---|
| Timeliness | Reports update in real time or on schedule without manual effort | Reports are created after data is collected, often causing delays |
| Accuracy | Data is pulled directly from sources, reducing manual errors | Higher chances of mistakes in formulas, data entry, or copying |
| Decision Speed | Faster decisions due to instant access to updated data | Slower decisions because reports take time to prepare |
| Leadership Confidence | Consistent data builds trust and improves confidence in reporting | Confidence may drop if reports vary or contain errors |
| Operational Waste | Reduces repetitive tasks and frees up team bandwidth | Significant time spent on repetitive reporting work |
| Visibility into Work | Central dashboards provide clear and continuous visibility | Limited visibility through static files or reports |
| Scalability | Easily handles growing data, teams, and clients | Becomes difficult to manage as workload increases |
Looking Closer: How These Differences Show Up in Daily Work
Instead of just comparing features, it helps to look at how these differences play out in real situations. This is where the gap between automated and manual reporting becomes more visible.
-
Time and Efficiency
Manual Reporting
Manual reporting takes effort at every step. You have to decide what data to pull, log into each platform, export the data, clean it, and then organise it into a usable format. Even if you are experienced, this process takes time and attention.If you miss a step or need to update something later, you often have to go back and redo parts of the process. Over time, this becomes repetitive and tiring.
Example: You export data from Google Analytics and ad platforms, paste everything into Excel, adjust columns, and then create slides for presentation. This process repeats every week or month.
Automated Reporting
With automation, most of this work happens once during setup. After that, the system keeps pulling and updating data on its own. Reports are either always available through dashboards or sent automatically at set intervals.Example: A dashboard updates automatically as new data comes in, and a weekly report is sent to stakeholders without any manual input.
-
Accuracy and Data Reliability
Manual Reporting
Manual work always carries a risk of error. Even small mistakes can change the outcome of a report. A wrong formula, a missed row, or incorrect data mapping can lead to inaccurate insights.The problem is not just the mistake itself. It is the fact that these mistakes are not always easy to detect immediately.
Example: An incorrect Excel formula leads to a lower revenue number being reported, affecting how performance is evaluated.
Automated Reporting
Automated systems pull data directly from the source. This reduces the chances of human error significantly. Once the connections are set correctly, the data flows as it is without manual interference.This makes reports more reliable, especially when dealing with large datasets.
Example: Revenue and conversion data are pulled directly from a CRM, ensuring the numbers match the actual records.
-
Scalability
Manual Reporting
Manual reporting works when the scale is small. But as soon as you add more clients, campaigns, or data sources, the workload increases quickly. Each new addition means more files, more tabs, and more time spent managing them.At some point, it becomes difficult to maintain consistency and quality across all reports.
Example: Managing reports for multiple clients leads to dozens of spreadsheets, each requiring individual attention and updates.
Automated Reporting
Automation handles scale much better. Once a system is in place, it can be extended to handle more data without significantly increasing effort. Templates and dashboards can be reused with minor adjustments.Example: The same reporting dashboard is used across 20 or more clients, with data sources adjusted for each one.
-
Consistency
Manual Reporting
In manual reporting, consistency often depends on the person creating the report. Even if there is a standard format, small changes can creep in over time. This makes it harder to compare reports across different periods.Example: One month the report focuses on clicks and impressions, while another month highlights conversions and revenue, making comparisons difficult.
Automated Reporting
Automated reporting maintains a fixed structure. Once the format is set, it stays the same across all reports. This helps in tracking performance over time without confusion.Example: The same report format is generated every month, making it easier to compare trends and patterns.
-
Insight vs Output
Manual Reporting
When reporting is done manually, a large part of the time goes into just building the report. By the time the numbers are cleaned, arranged, and presented, there is very little energy left to actually study what the data is saying.This often leads to reports that look complete but do not go deep into performance analysis. The focus stays on output instead of understanding.
Example: A team spends hours preparing a presentation, but only briefly reviews what is driving performance or where improvements are needed.
Automated Reporting
Automation changes this balance. Since the report is already prepared and updated, the team can spend more time looking at trends, patterns, and opportunities.Example: Instead of building slides, the team reviews campaign performance and adjusts targeting, budgets, or creatives based on live data.
-
Decision Making Speed
Manual Reporting
In manual setups, there is always a delay between what happens and when it is reported. By the time the report is ready, the situation may have already changed.This delay affects how quickly teams can respond to problems or opportunities.
Example: A performance drop is noticed only after the weekly report is prepared, which is two or three days later.
Automated Reporting
With automated systems, data is updated continuously or at short intervals. This means teams can spot changes as they happen and act faster.This speed can make a noticeable difference, especially in fast-moving campaigns.
Example: A live dashboard shows a sudden drop in conversions, allowing the team to adjust campaigns immediately.
-
Visibility and Accessibility
Manual Reporting
Manual reports are usually shared as files. These could be Excel sheets, PDFs, or presentations sent through email. Access depends on when the report is shared and who receives it.This limits visibility, especially for stakeholders who want to check performance at any time.
Example: A client waits for a monthly report instead of being able to check progress anytime.
Automated Reporting
Automated reporting provides continuous access through dashboards. Anyone with permission can log in and view the latest data whenever needed.This improves transparency and reduces dependency on report sharing.
Example: A client logs in to view live campaign performance instead of waiting for a report.
Advantages of Automated Reporting
Here’s a closer look at why many teams are moving towards automation:
-
Reduced Human Error
Since data flows directly from connected platforms, the chances of manual mistakes are much lower. This improves trust in the numbers being reported.
-
Real-time Reporting
Data is always up to date. You do not have to wait for reports to be created manually. This helps teams stay aligned with current performance.
-
Enhanced Data Security
Most automated tools offer controlled access and secure storage. This reduces the risks that come with sharing files manually.
-
Customizable Templates
You can design report templates once and reuse them. This saves time while keeping reports consistent.
-
Seamless Integration
Multiple data sources can be connected into one system. This removes the need to switch between platforms and combine data manually.
Challenges of Automated Reporting
Even though automation solves many problems, there are a few things to keep in mind:
-
High Upfront Cost
Setting up automated reporting tools may require an initial investment, especially for advanced platforms.
-
Training Requirements
Teams need time to understand how to use the tool properly. Without proper setup, automation may not deliver the expected results.
-
Dependence on System Reliability
If integrations break or data sources fail, reporting can be affected. Regular monitoring is still required.
Advantages of Manual Reporting
Manual reporting is not completely outdated. It still has some practical uses:
-
Low Initial Cost
You can start with basic tools like spreadsheets without investing in new software.
-
Customizable Formatting
Reports can be structured exactly the way you want without tool limitations.
-
Direct Oversight
You control every step of the process, which can be useful for small or highly specific reports.
Challenges of Manual Reporting
At the same time, manual reporting comes with clear limitations:
-
High Risk of Human Error
Mistakes in formulas or data handling can lead to incorrect conclusions.
-
Time-consuming
Each report requires fresh effort, which adds up over time.
-
Limited Real-time Access
Data is only updated when someone manually refreshes it.
-
Data Security Concerns
Sharing files manually increases the risk of data exposure.
-
Poor System Integration
Data from different platforms stays disconnected, making analysis harder.
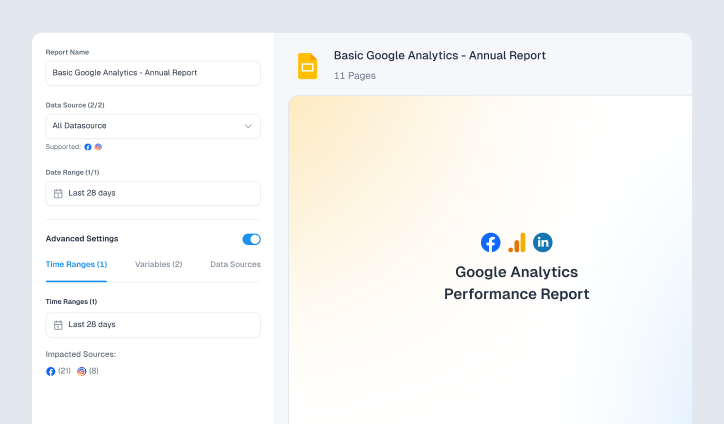
How to Automate Reports with ViewMetrics
If you are planning to move away from manual reporting, tools like ViewMetrics can help simplify the transition. Here’s how you can use ViewMetrics to automate your reports:
-
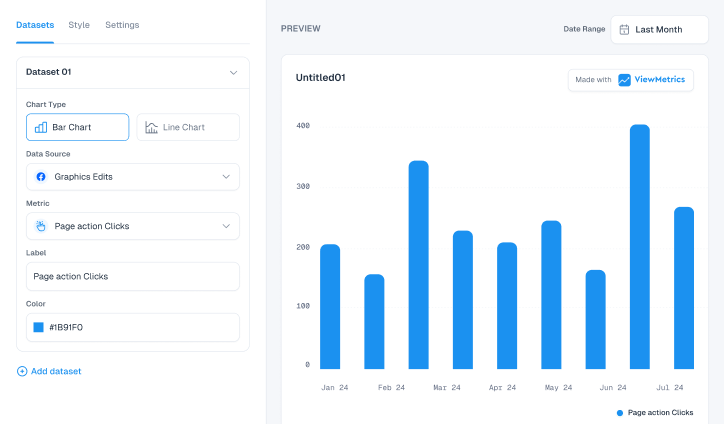
Define Your Goals and Key Metrics
Before setting up any dashboard, you need clarity on what you actually want to track. Without that, reports tend to get cluttered with too many numbers that do not help decision-making.
With ViewMetrics, you can focus only on the metrics that matter to your campaigns or clients and structure your reports around them.
Example: Instead of tracking every available metric, you set up a report that focuses on organic traffic, ad spend returns, and lead conversions. This keeps the report clean and easier to act on.
-
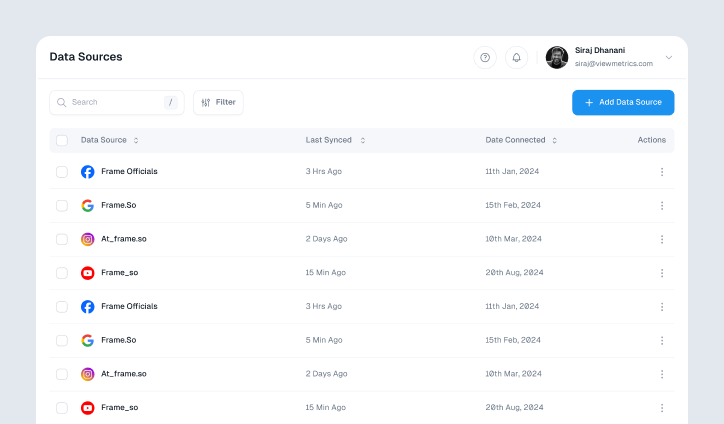
Connect All Your Data Sources
One of the biggest pain points in manual reporting is switching between platforms and combining data. ViewMetrics solves this by allowing you to connect multiple data sources in one place.
Once connected, the data flows into your dashboard automatically, without repeated exports or copy-paste work.
Example: Your website analytics, ad campaign data, and lead tracking system are all linked to a single dashboard, so you can see performance without jumping between tools.
-
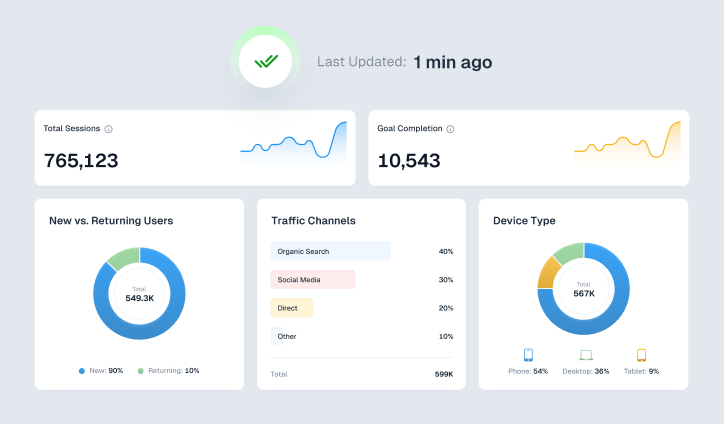
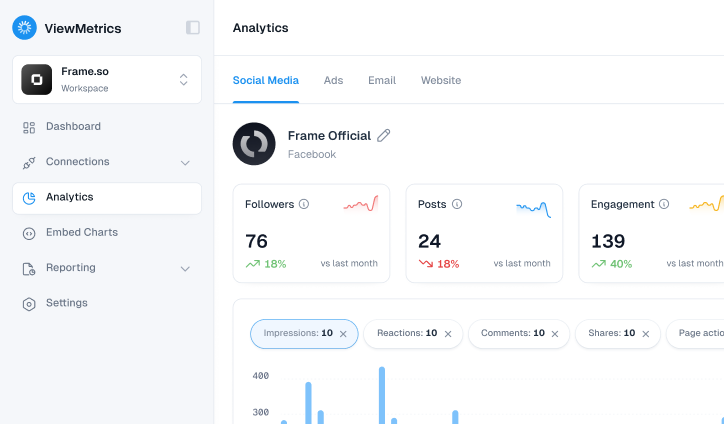
Build Real-time Dashboards
After your data is connected, the next step is creating dashboards that reflect your reporting needs. ViewMetrics allows you to design dashboards that update as new data comes in.
This becomes your main reporting view, replacing static files and presentations.
Example: Instead of preparing a weekly performance report, you create a dashboard that always shows the latest numbers, so you can check campaign performance at any time.
-
Automate Report Creation and Delivery
Manually preparing and sending reports is one of the most repetitive parts of reporting. With ViewMetrics, you can automate this entire process.
Reports can be scheduled and shared automatically with clients or team members, without needing reminders or manual effort.
Example: A monthly performance report is generated and sent to clients at the start of every month, without you having to build or send it manually.
-
Enable Auto Sync and Data Accuracy
Keeping data updated is just as important as collecting it. ViewMetrics ensures that your dashboards stay current by syncing data at regular intervals.
This reduces the chances of outdated or inconsistent reporting.
Example: Your dashboard refreshes daily, so when you log in, you are always looking at the most recent campaign performance without needing to update anything.
-
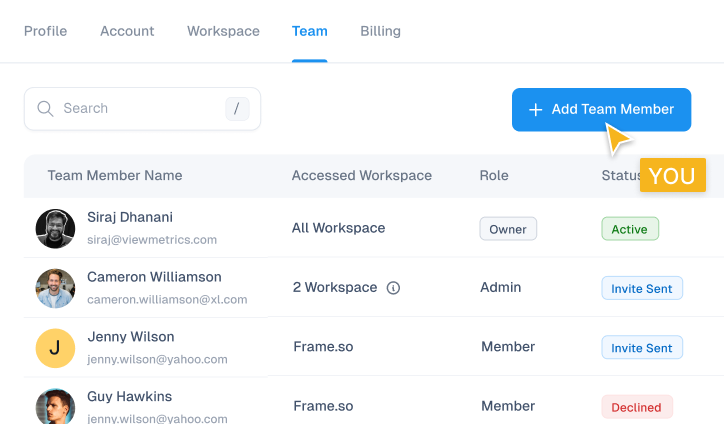
Collaborate and Share with Ease
Reporting often involves multiple people, from internal teams to clients. ViewMetrics makes it easier to share access without sending files back and forth.
This improves transparency and reduces delays in communication.
Example: Instead of emailing reports, you give clients access to their dashboard so they can log in and check performance whenever they want.
-
Customize, Reuse, and Scale Reporting
As your workload grows, consistency becomes important. ViewMetrics allows you to create templates that can be reused across different clients or campaigns.
This helps you maintain a standard structure without starting from scratch every time.
Example: You design one reporting template and apply it across multiple clients, adjusting only the data sources while keeping the format consistent.
Closing Thoughts
Manual reporting can still work when the scale is small and the data is simple. But as soon as things grow, it starts taking more time than it should.
Automated reporting changes that by removing repetitive work and making data easier to access. The real benefit is not just faster reports, but better use of time. Instead of preparing reports, teams can focus on understanding and improving performance.
If reporting feels like a task that keeps repeating itself, it is usually a sign that automation can make a difference.
Frequently Asked Questions (FAQs)
-
Is manual reporting still useful?
Yes, it works well for small datasets or one-time reports where flexibility is needed.
-
Does automated reporting reduce human error?
Yes, since data is pulled directly from sources, the chances of manual mistakes are much lower.
-
Can automated reports be customized for different clients?
Yes, most tools allow you to create templates that can be adjusted based on client requirements.
-
How does automated reporting improve business performance?
It provides faster access to data, which helps teams make quicker and more informed decisions.
-
What tools are commonly used for automated reporting?
Tools like ViewMetrics, Google Data Studio, and similar platforms are widely used.
-
Can small agencies benefit from automated reporting?
Yes, it helps them save time and manage multiple clients more efficiently.
-
Why is automated reporting important for marketing teams?
It allows teams to focus more on improving campaigns instead of spending time on report creation.