Reports are one of those things every business uses, but not everyone really understands how many types actually exist. Some reports help you track marketing performance, some help your team stay aligned, and others are meant for clients or stakeholders outside your company.
In this blog, we will walk through 21 different types of reports, what they are used for, and when you should use each one.
How to Use This Page
To keep things simple, we have grouped all 21 report types into three categories based on how they are used in a business setting. You can either go through everything step by step or jump directly to the section that matches what you are working on.
Here is a quick way to understand each category:
| Categories | Usage | Type of reports |
|---|---|---|
| Marketing Report | Use these reports to track, analyze, and improve your marketing performance, campaigns, and customer engagement. | Social Media Report, Email Marketing Report, SEO Report, PPC Marketing Report, Web Analytics Report, Content Marketing Report, Digital Marketing Report |
| Internal Report | These reports help teams monitor day-to-day operations, make data-driven decisions, and improve internal processes. | Operational Report, Progress Report, Quarterly Business Review, Team Performance Report, Informal Report, Proposal Report, Vertical Report, Lateral Report |
| External Report | Use these reports to communicate business performance, insights, and outcomes to clients, stakeholders, or external partners. | Informational Report, Long Report, Formal Report, Analytical Report, Annual Report, Financial Report |
21 Types of Reports to Use in Business
Marketing Report
Marketing reports are structured documents that track, analyze, and summarize the performance of marketing activities across channels like social media, SEO, email, and ads.
They help businesses understand what’s working, measure ROI, and make data-driven decisions to improve future campaigns.
| Report | Purpose | Primary Audience | Key Metrics |
|---|---|---|---|
| Social Media Report | Track performance and engagement across social platforms |
Marketing team, Social media managers
|
FollowersLikesSharesCommentsReachImpressions
|
| Email Marketing Report | Measure the effectiveness of email campaigns |
Marketing team, CRM managers
|
Open rate, Click-through rate, Bounce rate, Unsubscribes
|
| SEO Report | Monitor search engine visibility and organic traffic growth |
Marketing team, Web managers
|
Keyword rankings, Organic traffic, Backlinks, Domain authority
|
| PPC Marketing Report | Evaluate the performance and ROI of paid ad campaigns |
Marketing team, Paid media managers
|
Impressions, Clicks, CPC, Conversion rate, ROAS
|
| Web Analytics Report | Understand website visitor behavior and traffic sources |
Marketing teamWeb developers
|
Sessions, Page views, Bounce rate, Avg. session duration
|
| Content Marketing Report | Assess how well the content is performing and driving engagement |
Marketing team, Content managers
|
TrafficTime on pageSharesLeads generated
|
| Digital Marketing Report | Provide an overall view of all digital marketing efforts |
Senior management, Marketing directors
|
Overall ROIChannel performanceTotal conversionsRevenue generated
|
1. Social Media Report
- What is this report?
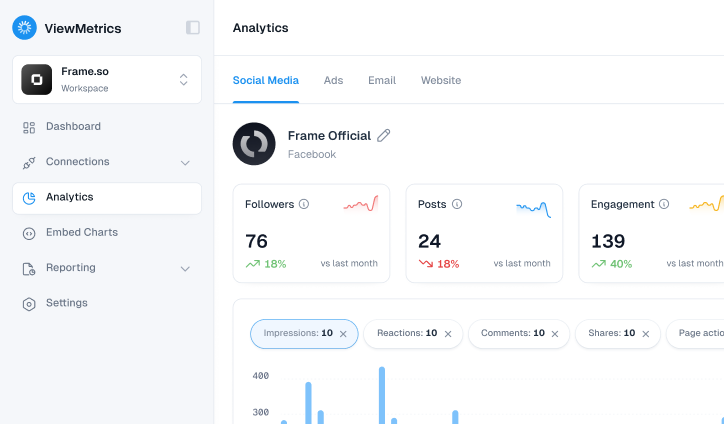
A social media report is a document that tracks and analyzes the performance of your content across platforms like Facebook, Instagram, and LinkedIn. It highlights key metrics such as engagement, reach, and follower growth to evaluate what’s working and guide future strategy. - Purpose
The goal is to understand how people are interacting with your content. You get a clear picture of what type of posts are getting attention and which ones are being ignored. - When to use this
Usually created weekly or monthly. It is also useful right after a campaign or product launch. - What is included (KPIs)
Follower growth, engagement rate, reach, impressions, clicks, comments, shares
In real terms, this report helps you stop posting blindly. You start noticing patterns. For example, maybe reels perform better than static posts, or maybe your audience responds more during weekends.
Related Read – Best Social Media Reporting Tools
2. Email Marketing Report
- What is this report
An email marketing report is a summary of how your email campaigns perform over time. It tracks key metrics like open rates, click-through rates, conversions, and unsubscribe rates to evaluate effectiveness and improve future campaigns. - Purpose
To understand whether people are opening your emails, clicking on links, and actually taking action. - When to use this
After each campaign or as a monthly summary. - What is included (KPIs)
Open rate, click-through rate, bounce rate, unsubscribe rate, conversions
Read More – Email Marketing Metrics
If you notice high opens but low clicks, it usually means your subject line worked, but your content did not. That is the kind of clarity this report gives you.
3. SEO Report
-
- What is this report
An SEO report is a document that tracks and evaluates your website’s performance in search engines. It includes key metrics like keyword rankings, organic traffic, backlinks, and technical health to measure visibility and guide optimization efforts. - Purpose
To see how your website content is performing in terms of rankings and organic traffic. - When to use this
Monthly is the most common. SEO takes time, so daily tracking does not help much. - What is included (KPIs)
Keyword rankings, organic traffic, backlinks, domain authority, and click-through rate
- What is this report
Read More – Best SEO KPIs to Track
This report is useful when you are publishing blogs or landing pages regularly. It tells you whether your content is actually getting discovered.
Read More – SEO Reporting Tools
4. PPC Report
-
- What is this report
A PPC (Pay-Per-Click) report is a document that analyzes the performance of paid advertising campaigns on platforms like Google Ads or social media. - Purpose
To understand if you are getting value for the money you are spending. - When to use this
Weekly during active campaigns or after campaign completion. - What is included (KPIs)
Cost per click, impressions, click-through rate, conversion rate, return on ad spend
- What is this report
Read More – Best KPIs PPC
This is where you quickly realise which ads are draining your budget and which ones are bringing results.
Read More – Best PPC Reporting Tools
5. Web Analytics Report
-
- What is this report
A web analytics report is a document that analyzes website performance using tools like Google Analytics. - Purpose
To understand user behaviour and improve the overall website experience. - When to use this
Monthly, or when you are making changes to your website. - What is included (KPIs)
Sessions, bounce rate, average session duration, pages per session, traffic sources
- What is this report
Read More – Website KPIs Every Marketer Should Track
For example, if people are leaving your homepage in a few seconds, something is clearly not working. This report helps you catch that.
6. Content Marketing Report
-
- What is this report
A content marketing report is a document that evaluates the performance of your content across channels like blogs, videos, and social media. - Purpose
To identify which content is bringing traffic, engagement, or leads. - When to use this
Monthly or after a content campaign. - What is included (KPIs)
Page views, time on page, engagement, shares, leads generated
- What is this report
Read More – Best KPIs Content Marketing KPIs to Track
Over time, this helps you understand what your audience actually wants to read or watch.
7. Digital Marketing Report
-
- What is this report
A digital marketing report is a comprehensive document that summarizes the performance of all online marketing activities across channels like SEO, social media, email, and paid ads. - Purpose
To get a complete view instead of looking at each channel separately. - When to use this
Monthly or quarterly. - What is included (KPIs)
Traffic, conversions, ROI, channel performance, lead generation
- What is this report
Read More – Best KPIs Digital Marketing
This report is useful when you want to see the bigger picture instead of getting lost in individual numbers.
Read More – Best Digital Marketing Reporting Tools
Internal Reports
Internal reports are more about keeping things running smoothly inside the company. They help teams stay aligned and avoid confusion.
| Report | Purpose | Primary Audience | Key Metrics |
|---|---|---|---|
| Operational Report | Monitor day-to-day business operations and performance |
Operations managers, Department heads
|
Output, efficiency, downtime, costs, error rates
|
| Progress Report | Provide updates on the status of a project or task |
Project managers, Team leads, Stakeholders
|
Tasks completed, milestones reached, deadlines met, blockers
|
| Quarterly Business Review | Review overall business performance over three months |
Senior management, Executives, Investors
|
Revenue, expenses, growth rate, targets vs. actuals
|
| Team Performance Report | Evaluate the productivity and effectiveness of a team |
HR managers, Department heads
|
Goals achieved, attendance, output per employee, KPIs met
|
| Informal Report | Share quick updates or findings in a casual, flexible format |
Colleagues, Direct managers
|
Varies by topic, no fixed metrics
|
| Proposal Report | Present a recommendation or plan to gain approval |
Decision makers, Senior management
|
Projected costs, expected ROI, timeline, and resources required
|
| Vertical Report | Share information up or down the organizational hierarchy |
Upper management or subordinates
|
Typically, performance, budget, or compliance data
|
| Lateral Report | Share information between departments or teams at the same level |
Peers, Cross-functional teams
|
Typically, project updates, shared goals, or joint KPIs
|
8. Operational Report
- What is this report
An operational report is a document that tracks the day-to-day activities and performance of business operations. It helps teams monitor workflows, identify issues, and make informed decisions to improve efficiency and overall performance. - Purpose
To make sure everything is running as expected. - When to use this
Daily or weekly. - What is included
Process updates, output levels, issues, and resource usage
This is the kind of report that helps managers catch problems early instead of reacting later.
9. Progress Report
- What is this report
A progress report is a document that provides updates on the status of a project or task over a specific period. It outlines completed work, ongoing activities, and any challenges to keep stakeholders informed and aligned. - Purpose
To keep everyone informed about what has been done and what is still pending. - When to use this
During ongoing projects. - What is included
Completed tasks, pending work, timelines, blockers
This is especially useful when multiple people are working on the same project.
10. Quarterly Business Review
- What is this report
A Quarterly Business Review (QBR) is a strategic meeting or report conducted every three months to evaluate business performance and progress. It focuses on reviewing achievements, discussing challenges, and aligning on priorities and goals for the upcoming quarter. - Purpose
To step back and look at growth, challenges, and direction. - When to use this
Every quarter. - What is included
Revenue trends, performance highlights, goals vs results, insights
It gives you a break from daily noise and helps you think bigger.
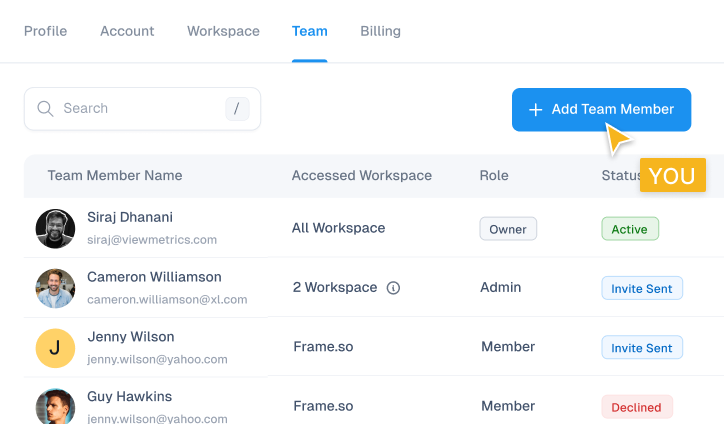
11. Team Performance Report
- What is this report
A team performance report is a document that evaluates how a team is performing over a specific period. It highlights achievements, identifies areas for improvement, and helps managers support better collaboration and productivity. - Purpose
To understand productivity and identify improvement areas. - When to use this
Monthly or quarterly. - What is included
Targets achieved, productivity levels, attendance, and output quality
It is useful not just for evaluation but also for recognising good work.
12. Informal Report
- What is this report
An informal report is a short, straightforward document used to communicate information quickly within an organization. It is typically less structured and more conversational, focusing on key updates, findings, or recommendations without a strict format. - Purpose
To quickly share updates without overthinking structure. - When to use this
For quick communication within teams. - What is included
Notes, observations, quick updates
Sometimes, you do not need a polished document. You just need clarity. This type of report helps with that.
13. Proposal Report
- What is this report
A proposal report is created when you want to suggest a new idea, solution, or project. It lays out what you are planning to do and why it makes sense. - Purpose
The goal here is to get approval. Whether it is from management, a client, or another team, this report helps you present your idea clearly and convincingly. - When to use this
Before starting a new project, launching a campaign, or introducing a change in process. - What is included
Problem statement, proposed solution, expected outcomes, cost estimates, timelines
A good proposal report does not just explain the idea. It answers questions before they are even asked.
14. Vertical Report
- What is this report
A vertical report moves information up or down the hierarchy in an organization. For example, from a team member to a manager, or from leadership to employees. - Purpose
To ensure clear communication between different levels of authority. - When to use this
When reporting progress to managers or sharing decisions with teams. - What is included
Updates, instructions, performance summaries, decisions
This type of report helps avoid miscommunication, especially in larger organizations where multiple layers exist.
15. Lateral Report
- What is this report
A lateral report is shared between teams or departments that are on the same level. - Purpose
To keep different teams aligned and working together smoothly. - When to use this
When collaboration is required across departments like marketing, sales, or operations. - What is included
Project updates, shared goals, timelines, dependencies
Without this, teams often end up working in silos, which slows everything down.
External Reports
| Report | Purpose | Primary Audience | Key Metrics |
|---|---|---|---|
| Informational Report | Present facts and data on a topic without analysis or recommendations |
Managers, General staff, Stakeholders
|
Raw data, statistics, compliance figures
|
| Long Report | Provide an in-depth, comprehensive examination of a complex topic |
Senior management, Executives, Researchers
|
Full analysis, supporting data, appendices
|
| Formal Report | Deliver structured, professional findings following a set format |
Senior management, Executives, External stakeholders
|
Financial data, strategic KPIs, governance metrics
|
| Analytical Report | Analyze data to identify trends, draw conclusions, and support decisions |
Management, Analysts, Decision makers
|
Trend analysis, benchmarks, insights, recommendations
|
| Annual Report | Summarize the overall performance and achievements of an organization over a year |
Executives, Investors, Board members, the Public
|
Revenue, profit/loss, growth rate, key achievements, future outlook
|
| Financial Report | Track and communicate the financial health and position of a business |
CFOs, Accountants, Investors, Auditors
|
P&L, cash flow, balance sheet, EPS, revenue growth
|
16. Informational Report
- What is this report
An Informational report is a document prepared for audiences outside the organization, such as clients, investors, or regulators. It communicates important information about the company in a clear, professional format tailored to external stakeholders. - Purpose
To share clear and straightforward information. - When to use this
When you need to inform about something important. - What is included
Data, summaries, factual updates
This is useful when the audience only needs visibility, not recommendations.
17. Long Report
- What is this report
A long report is a detailed and comprehensive document that explores a topic in depth. It includes structured sections such as introduction, analysis, findings, and conclusions to provide a complete understanding of the subject. - Purpose
To provide complete information when a subject cannot be explained briefly. - When to use this
For research, large projects, or complex topics. - What is included
Background, research, data, analysis, findings, recommendations
These reports take time to create, but they are valuable when decisions depend on detailed information.
18. Formal Report
- What is this report
A formal report is a structured and professionally written document used to present information in a clear and organized manner. It follows a standardized format and is typically used for important decisions, research findings, or official communication. - Purpose
To present information clearly and officially. - When to use this
When dealing with clients, stakeholders, or senior management. - What is included
Executive summary, methodology, data, analysis, conclusions
The structure matters here. It reflects how seriously the information is being presented.
19. Analytical Report
- What is this report
An analytical report is a document that examines data or information to identify patterns, insights, and underlying causes. It goes beyond simply presenting facts by interpreting findings to support decision-making and recommendations. - Purpose
To support decision-making by offering insights and recommendations. - When to use this
When decisions depend on interpretation, not just raw numbers. - What is included
Data analysis, trends, comparisons, conclusions, recommendations
This is where reporting moves beyond numbers and starts influencing real decisions.
20. Annual Report
- What is this report
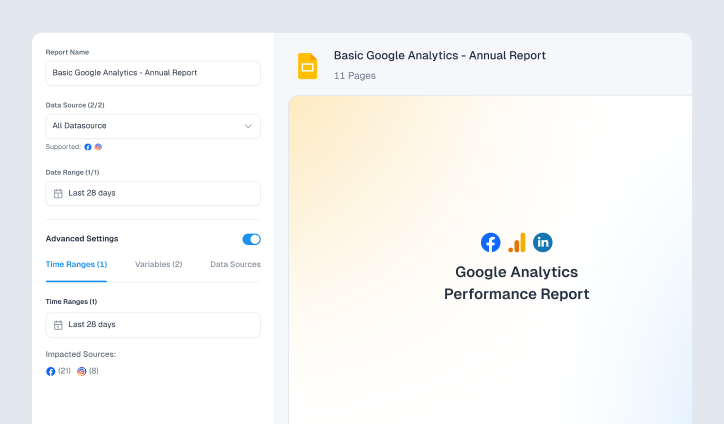
An annual report is a comprehensive document that summarizes a company’s activities and overall performance over the past year. It is typically shared with stakeholders to provide a clear overview of progress, achievements, and future direction. - Purpose
To give a complete picture of growth, achievements, and direction. - When to use this
At the end of the financial year. - What is included
Financial performance, major milestones, business highlights, future plans
This report is often shared publicly, so it also reflects the company’s image.
21. Financial Report
- What is this report
A financial report is a document that presents an overview of a company’s financial activities and position over a specific period. It helps stakeholders understand the organization’s financial health and supports informed decision-making. - Purpose
To track the financial health of a business. - When to use this
Monthly, quarterly, or yearly, depending on the requirement. - What is included
Revenue, expenses, profit, cash flow, balance sheets
This is one of the most critical reports because it directly shows whether the business is sustainable.
How to Choose the Right Type of Reporting?
If you pick the wrong type, you either end up with too much information or not enough clarity. So instead of guessing, you can follow a simple thought process.
-
Start With Your Purpose
Before creating any report, first ask yourself why you are making it. Your purpose, whether to track performance, solve a problem, or share updates, guides the type of report you choose. Once the purpose is clear, the report structure becomes much easier to define.
-
Identify Your Audience
Who will read this report matters more than most people think.
Reports for internal teams can be more direct, while those for clients or investors should be structured and easy to follow.
If the audience is non-technical, keep it simple and focus on explaining what the information means. -
Decide the Frequency
Not every report needs to be created frequently; some are daily, others monthly or quarterly. Too many reports create noise, while too few can miss insights, so balance is important.
-
Consider the Type of Data
Think about the type of data you are working with, whether it’s numerical or descriptive, and choose a format that fits it. Use visuals like charts for numbers and clear writing for explanations, as the right format makes information easier to understand and prevents confusion.
-
Understand the Use Case
Think about what should happen after the report is read, as this often shapes how it should be written. If it’s meant to drive decisions, include insights and suggestions, while simple updates can stay factual. Choosing the right approach ensures the report serves its purpose effectively.
-
Choose the Right Format
Once everything is clear, decide the format that best presents your report, whether it’s a dashboard, a detailed document, or a simple summary. The format should make information easy to understand, not more complicated, so readers can quickly grasp the key points.
Closing Thoughts
Reports are not just documents you create and forget. They help you understand what is working, what needs attention, and where you should focus next.
Once you know which type of report to use, things become much clearer. You stop guessing and start making decisions based on actual data. That shift, even if it feels small, can make a big difference in how a business grows over time.
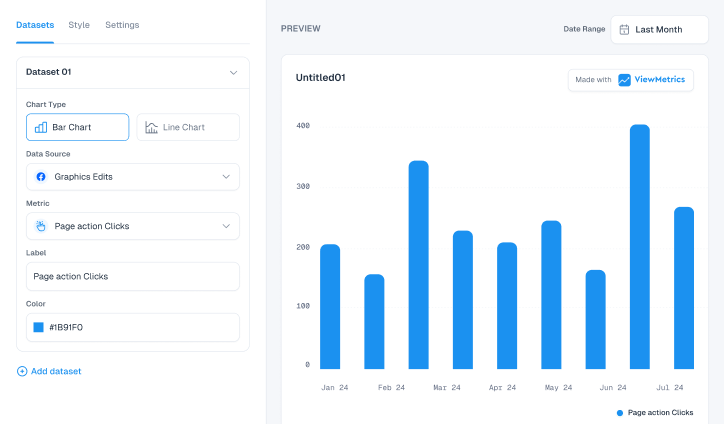
If you are handling multiple marketing channels, creating reports manually can quickly become repetitive. This is where tools like Viewetrics can help. Instead of pulling data from different platforms and building reports from scratch, you can automate the entire process and get everything in one place. It saves time and also reduces the chances of missing important insights.
Frequently Asked Questions (FAQs)
-
What are the main elements of a good report?
A good report is easy to follow and does not leave the reader confused. It usually has a clear structure, reliable data, simple language, and some visual support like charts or tables. Most importantly, it should help the reader understand what to do next instead of just showing numbers.
-
Why are reports important in a business?
Reports help you see what is actually happening in your business. Without them, decisions are often based on assumptions. They help track performance, highlight problems early, and keep everyone on the same page.
-
When should you use an informational report?
You can use an informational report when your goal is to share facts without adding opinions. For example, giving updates, sharing results, or presenting data without analysis. It keeps things straightforward and avoids overcomplication.
-
How do you report project progress to stakeholders?
The simplest way is to use a progress report. It should clearly show what has been completed, what is still pending, any delays, and what comes next. Keeping it structured helps stakeholders understand the situation quickly.
-
Which report works best for presenting business data to executives?
Executives usually prefer reports that focus on insights instead of raw data. Analytical reports or summary reports work well because they highlight important numbers, trends, and what actions should be taken next.
-
How do you present financial performance clearly?
Financial data can get confusing if it is just numbers on a page. Using charts, summaries, and clear breakdowns makes it easier to understand. The idea is to show the bigger picture without overwhelming the reader.
-
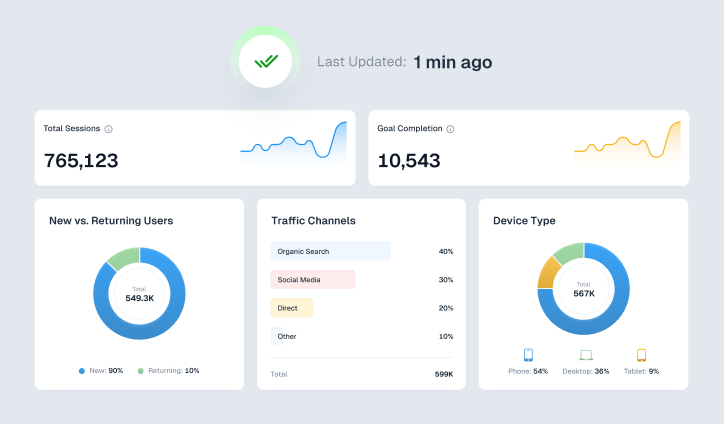
How do you monitor real-time business performance?
For real-time tracking, dashboard reports are the most useful. They show live data and important metrics in one place, so you can quickly understand what is happening and respond if needed.
-
How do you communicate results to non-technical audiences?
The best approach is to simplify everything. Use clear language, avoid technical terms, and include visuals where possible. Focus more on what the data means rather than how it was calculated.