What Is Client Reporting?
Client reporting is the structured process of sharing, analyzing, and presenting performance data, KPIs, and results to clients on a regular basis. It turns complex marketing data into clear insights that your client can understand and act on.
Instead of sending raw numbers, an effective report focuses on:
- Explaining what happened in the particular campaign
- Showing why it happened
- Recommending steps on what to do next
What Is the Importance of Making a Client Report for Agencies & Marketers?
Here’s why agencies and marketers need to share a clear report with the client:
- Client reporting builds trust by keeping everything transparent and easy to understand.
- It demonstrates your value through clear performance insights and measurable results.
- Reports keep everyone accountable, ensuring both you and your client stay aligned.
- It reduces unnecessary communication, as regular updates eliminate constant follow-ups.
- A client report also keeps the client engaged at all stages, helping them stay involved in the strategy.
- It creates a record of performance, useful for future planning.
- It gives you a competitive edge, as better reporting often leads to higher retention.
What Does a Client Report Typically Include?
A good client report is structured, easy to read, and focused on insights rather than just numbers.
Here are the key elements every report should include:
- Executive Summary: A quick overview of performance and key highlights.
- KPIs Aligned with the Goals: Metrics like revenue, leads, or conversions.
- Channel Performance Data: Insights from SEO, paid ads, social media, and email.
- Insights & Context: Explanation of why performance changed.
- Recommendations & Next Steps: Clearly mention actionable steps that need to be taken to improve results.
Types of Client Reports with Examples
There are different client reporting types, depending on their goals, involvement level, and how deeply they want to analyze performance. Choosing the right type helps you communicate insights more effectively and avoid overwhelming them.
Here are the most common client reporting examples:
1. Comprehensive Reports (Full Performance Overview)
A comprehensive report gives a complete view of all marketing activities across channels. It is best suited for monthly or quarterly reporting when clients want to see overall performance.
It combines multiple data sources into one structured report, making it easier to understand how different channels contribute to results.
Example:
A monthly report showing:
- Website traffic from Google Analytics
- Ad performance from Google Ads and Facebook
- Email campaign results
- Overall leads and conversions
2. Channel-Specific Reports (Focused Performance Analysis)
This type of report focuses on one specific marketing channel, such as SEO, PPC, or social media. It is useful when clients want deeper insights into a particular area.
It helps you break down performance and identify what is working within that channel.
Example:
An SEO report that includes:
- Keyword rankings
- Organic traffic growth
- Backlink performance
- Top-performing pages
3. Campaign-Based Reports (Short-Term Performance Tracking)
Campaign reports are designed to track the performance of a specific marketing campaign over a defined period.
They are especially useful for launches, promotions, or paid campaigns where results need close monitoring.
Example:
A report for a product launch campaign showing:
- Click-through rates (CTR)
- Conversion rates
- Cost per acquisition (CPA)
- Campaign ROI
4. Executive Reports (High-Level Summary for Decision Makers)
Executive reports are simplified versions of client reporting designed for stakeholders who do not need detailed data.
They focus on key outcomes and business impact rather than granular metrics.
Example:
A one-page summary that highlights:
- Total revenue generated
- Lead growth percentage
- Key wins and challenges
- Strategic recommendations
5. Performance Trend Reports (Long-Term Insights and Growth Patterns)
Trend reports track performance over time, helping clients understand patterns and long-term growth.
They are useful for identifying seasonality, consistent improvements, or areas that need attention.
Example:
A quarterly report showing:
- Traffic growth over a period of 3 to 6 months
- Lead trends across campaigns
- Month-on-month conversion changes
- Seasonal spikes in performance
Best Practices to Follow for Client Reporting
If your reports are not driving conversations or decisions, they are not doing their job. Here are some best practices to improve your client reporting process:
- Focus on Insights, Not Just Data: Do not just present numbers. Explain what they mean and why they matter for the client’s goals.
- Align Reports with Client Goals: Only include metrics that connect directly to what the client cares about, such as leads, revenue, or growth.
- Keep Reports Simple & Clear: Use simple language and clean formatting so clients can understand the report without confusion.
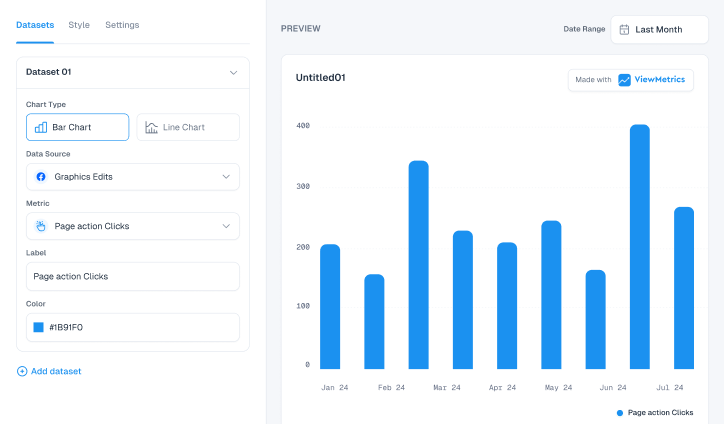
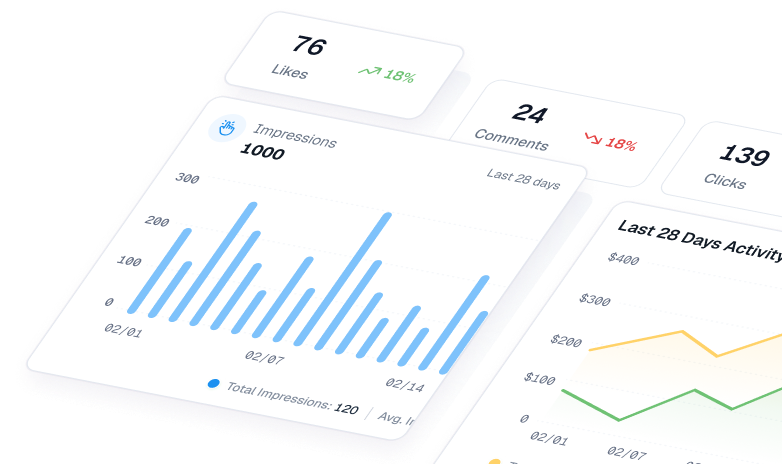
- Use Visuals for Better Understanding: Add charts and graphs to make performance easier to grasp at a glance.
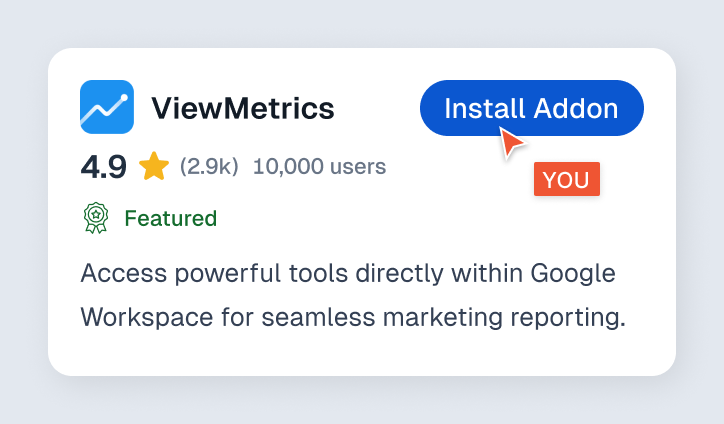
If you are handling multiple clients, tools like ViewMetrics can help you automate client reporting while keeping it clear and consistent.
How ViewMetrics Helps You Manage Multiple Clients with Automated Client Reporting
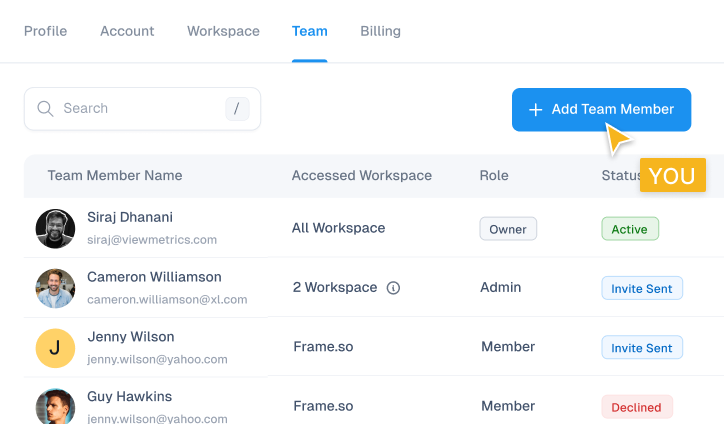
Managing client reporting manually can take hours every week, especially when you are handling multiple clients. This is where ViewMetrics makes a real difference.
With ViewMetrics, you can:
- Automate report creation and scheduling, saving time and reducing repetitive manual work.
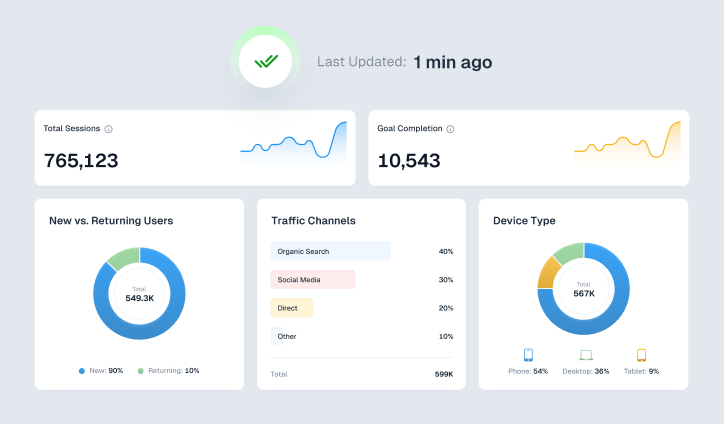
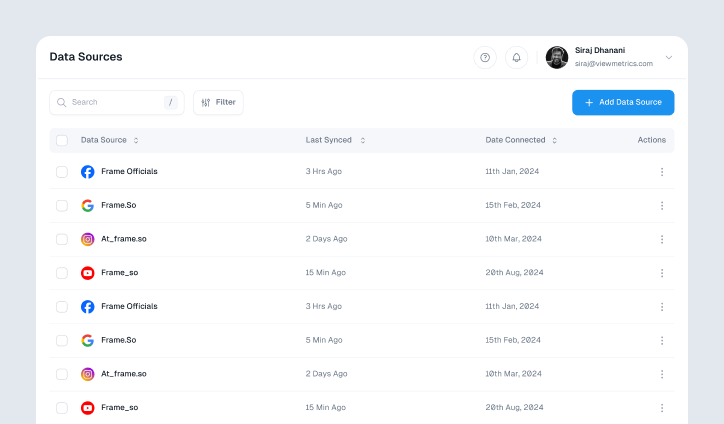
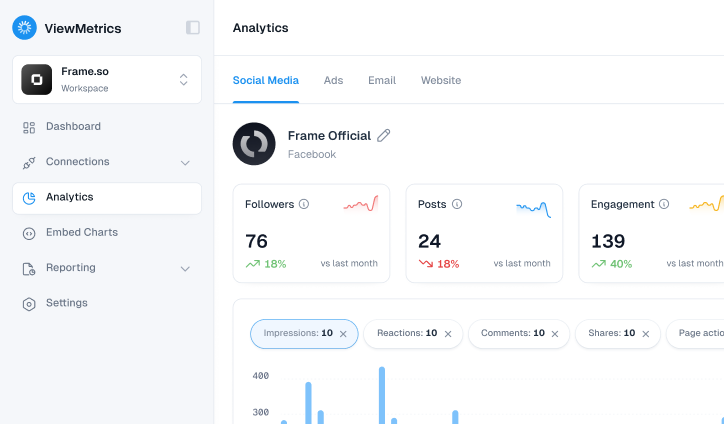
- Integrate multiple data sources into one dashboard, so you do not have to switch between tools.
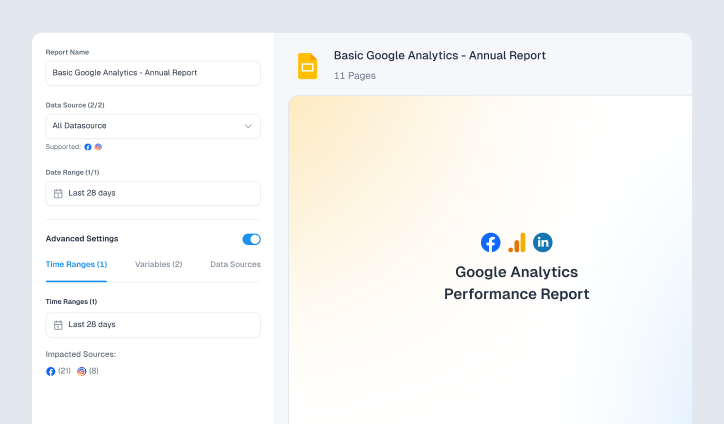
- Use ready-made templates to create consistent and professional reports quickly.
- Export reports easily in formats like PowerPoint or Excel for sharing.
- Visualize data clearly with charts and structured layouts that clients can actually understand.
So, instead of spending time building reports, you can focus on strategy and growth. If you manage multiple clients, this can significantly improve efficiency and consistency.


View All Your Marketing and Website Data - Instantly
 Connect Instagram, Mailchimp, Google Analytics & more
- Pre-built dashboards, no setup needed
- Save hours on reporting every week
FAQs
1. What is the purpose of client reporting?
The purpose of client reporting is to keep clients informed about progress, demonstrate value, and maintain transparency. It also ensures accountability for both parties.
2. How often should you send client reports?
Most agencies send reports monthly. However, weekly updates work for new campaigns, while quarterly reviews suit long-term strategies.
3. What should be included in a client report?
A client report should include an executive summary, goal-based KPIs, channel data, insights, and actionable recommendations.
4. What is the difference between a client report and a dashboard?
A report is a periodic summary of performance, while a dashboard is a real-time view of metrics that clients can access anytime.
5. How can you improve your client reporting process?
You can improve client reporting by automating data collection, aligning metrics with goals, using clear visuals, and maintaining consistency.