Reporting is not just about sharing numbers. It is about helping people understand what is working and what needs attention. When done right, a report can guide better decisions and save a lot of time.
In this blog, we will walk through 13 reporting best practices you should follow to make your reports clearer, more useful, and easier to act on.
13 Reporting Best Practices You Should Follow
-
Choose Your KPIs and Metrics Carefully
Not every number deserves a place in your report. When you include too many metrics, the main message gets lost. Instead, focus on the ones that directly connect to the goal.
For example, an SEO agency avoids cluttering a report with dozens of metrics like page views, bounce rate, and session duration. It highlights only the most relevant ones, such as organic traffic, keyword rankings, and conversions. This makes the report easier to understand and helps the client make clearer decisions.
-
Customize Your Reports to Each Client
A report should feel like it was made for the person reading it. Different clients care about different outcomes. If you send the same format to everyone, it quickly loses value.
For example, a marketing agency creates separate reports for two clients. For an eCommerce brand, it focuses on revenue, conversion rate, and top-selling products. For a local service business, it highlights leads, call inquiries, and local search visibility. This way, each report connects directly to what the client actually cares about.
-
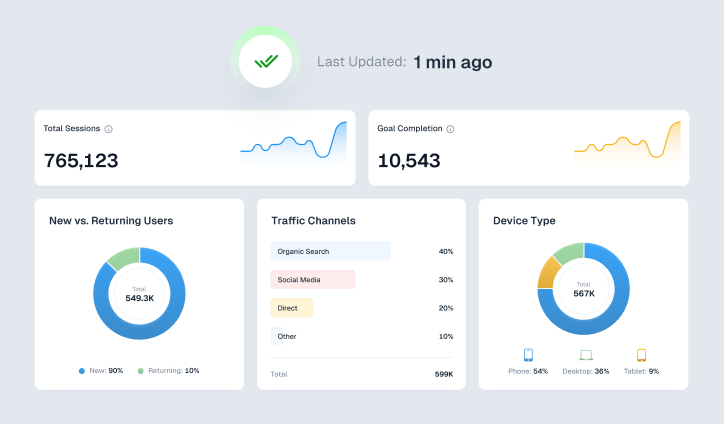
Leverage Real-Time Data Integration
Waiting for weekly or monthly reports can slow down decisions. Real-time data helps you react faster and avoid losses.
For example, a digital marketing team tracks a live dashboard that shows ad performance throughout the day. If the cost per click suddenly increases, they pause the campaign or adjust targeting immediately. This prevents wasted budget and improves results without delay.
-
Maintain Data Accuracy and Consistency
If your data does not match across platforms, it creates confusion. Teams end up debating numbers instead of making decisions.
For example, a company may report 500 conversions in marketing data but only 320 sales in the CRM. This happens because one team counts form submissions while another counts actual purchases. By defining a conversion as a paying customer and using a single source of truth, the company brings consistency and avoids misalignment.
-
Show Your Data Year Over Year
Looking at current numbers without context can be misleading. Year-over-year comparisons help you understand real growth.
An eCommerce business may see a spike in sales in December and assume its performance has improved. However, when compared year-over-year, they realize that sales actually grew only 5 percent compared to the previous December, indicating steady but not exceptional growth. This comparison helps account for seasonal trends like holidays and ensures decisions are based on true performance rather than temporary fluctuations.
-
Look at Where Users Drop Off
Understanding where people leave your website or funnel, can reveal hidden problems.
For example, an eCommerce site notices many users exiting on the shipping page. After reviewing the data, they realise high delivery charges and unclear timelines are the issue. They introduce free shipping thresholds and clearer messaging, which reduces drop-offs and improves conversions.
-
Avoid Showing Irrelevant Data
Not every positive number is useful. If it does not connect to the goal, it only adds noise.
For example, an SEO agency includes a spike in Instagram followers in a report focused on organic traffic growth. While the number looks good, it does not support the main objective. Removing such metrics keeps the report focused and easier to understand.
-
Explain Data in Simple Terms
Numbers alone do not tell the full story. You need to explain what they mean in plain language.
For example, instead of saying the bounce rate dropped by 12 percent, you can explain it as more visitors are staying on the website and exploring multiple pages. This makes the insight clearer, even for someone without technical knowledge.
-
Use Data to Tell a Story
A report should not feel like a list of numbers. It should show what happened, why it happened, and what it means.
For example, instead of just stating that traffic increased by 30 percent, you explain that the growth came after publishing new blog content and most of it was from organic search. This shows the impact of your actions and gives direction for future work.
-
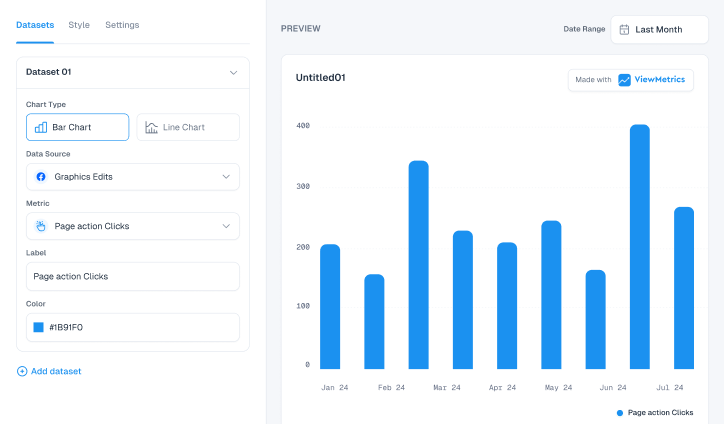
Make Your Reports Visually Clear
Good visuals help people understand patterns quickly. Long tables often make reports harder to read.
For example, instead of showing rows of traffic data, a marketer uses a line graph to show trends over time and a bar chart to compare channels. This makes it easier to spot growth, dips, and top performers without spending too much time.
-
Ensure Accessibility and Collaboration
Reports should be easy to access and discuss. If people cannot interact with the data, it limits its value.
For example, instead of sending static PDFs, a company shares a live dashboard where team members and clients can view updates, leave comments, and discuss insights. This improves collaboration and speeds up decision-making.
-
Automate Report Delivery
Manual reporting takes time and increases the chance of errors. Automation helps maintain consistency.
For example, a marketing team sets up automated weekly reports that are sent every Monday morning. Clients receive updates on time, and the team can spend more time improving campaigns instead of building reports from scratch.
-
Add Clear Recommendations
A report should not stop at insights. It should guide the next steps.
For example, instead of only showing that traffic dropped by 20 percent, a marketer suggests updating old content, improving internal linking, and optimizing weaker pages. This gives stakeholders a clear direction instead of leaving them with unanswered questions.
Create Better Reports with ViewMetrics
If you are handling multiple clients or channels, managing reports manually can quickly become overwhelming. This is where ViewMetrics makes things simpler.
ViewMetrics allows you to pull data from different marketing platforms and bring everything into one place. Instead of switching between tools, you get a single dashboard or report that shows the complete picture. This saves time and reduces errors caused by scattered data.
Here is how it helps in real work:
-
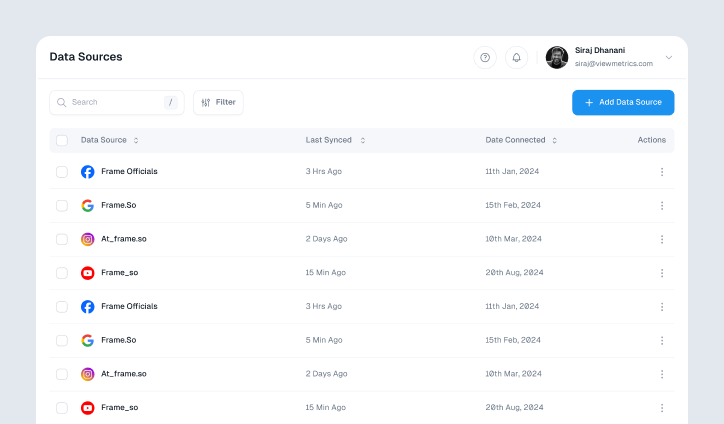
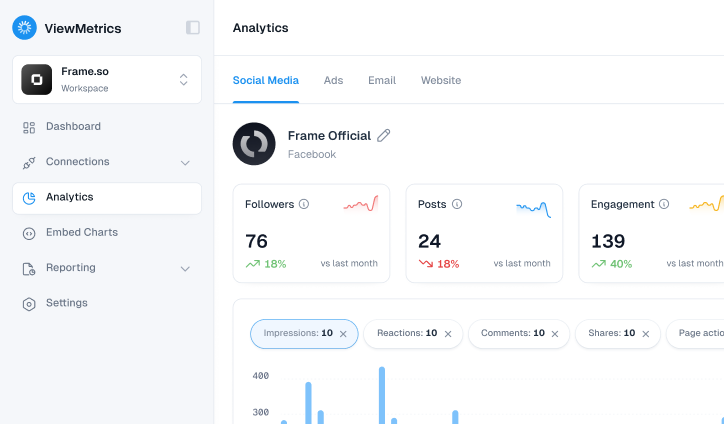
Centralized Reporting
All your marketing data lives in one dashboard. You do not need to collect numbers from different tools manually.
-
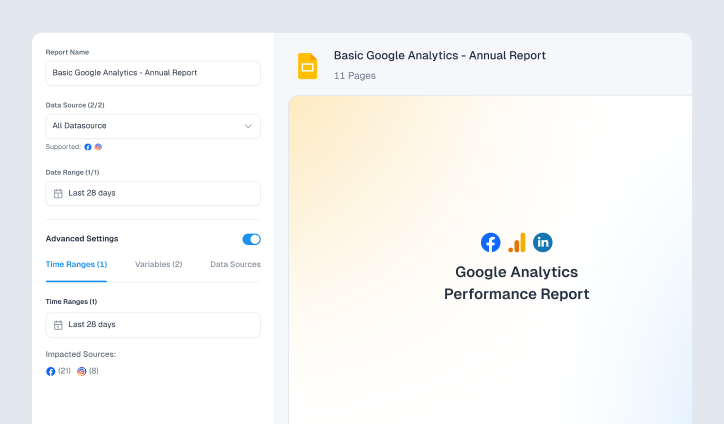
Automated Reports
You can create reports that update automatically. Metrics, charts, and even screenshots can be added to Google Slides or Sheets without manual effort.
-
Custom Templates
You can design your own report templates or use ready-made ones. This helps maintain consistency across clients.
-
Flexible Data Syncing
Reports can refresh daily, weekly, or monthly. Once you set it up, the data stays updated everywhere.
-
Google Workspace Integration
ViewMetrics works directly with Google Slides, Sheets, and Docs. You can pull live data into your documents without extra steps.
-
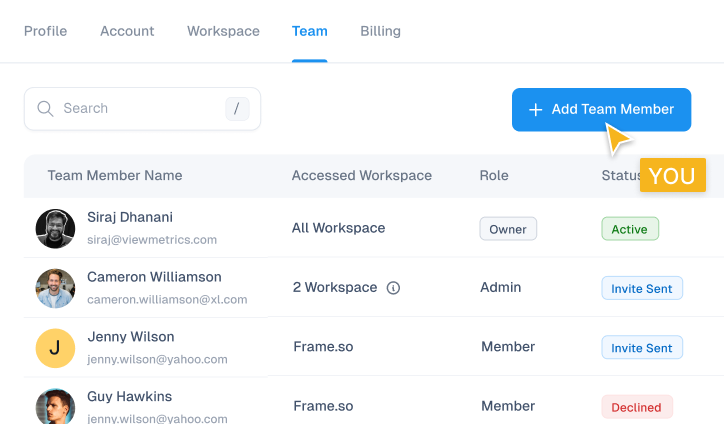
Workspaces for Better Organization
You can create separate workspaces for each client or project. This keeps data clean and easy to manage, especially if you handle multiple accounts.
-
Collaboration Made Simple
You can invite team members or clients to specific workspaces. Everyone can access the same data and stay aligned.
-
Actionable Dashboards
The platform does not just show numbers. It helps you spot trends, track performance, and make decisions based on clear insights.
Overall, ViewMetrics reduces the time spent on reporting and helps you focus more on analysis and strategy.
Closing Thoughts
Good reporting is not about adding more data. It is about making the right data easier to understand and act on.
When you follow these practices, your reports become clearer, more focused, and more useful for decision-making. Over time, this builds trust and helps teams move faster with better clarity.